Save 50–90% On Geo-Grid Rank Tracking.
Guaranteed.
Our Competitors Hate Us. Here’s Why: every other geo-grid tool sells you the same DataForSEO data with a markup. We don’t. Bring your own API key, run grids as wide as you want, and stop getting ripped off. Simple. Transparent. Fair.
- Bring Your Own Key
- No API Markup
- Scale Indefinitely
Everything You Need. Nothing You Don’t.
Everything competitors charge thousands for. Yours for 50–90% less. Every box checked. No filler, no upsell paywalls.
Recurring Grid Scans
Daily, weekly, or monthly automated scans. Set the schedule once — fresh grid data without lifting a finger.
On-Demand Scans
Need a fresh scan right now? Fire one off in a single click — no waiting for tomorrow’s auto-cycle.
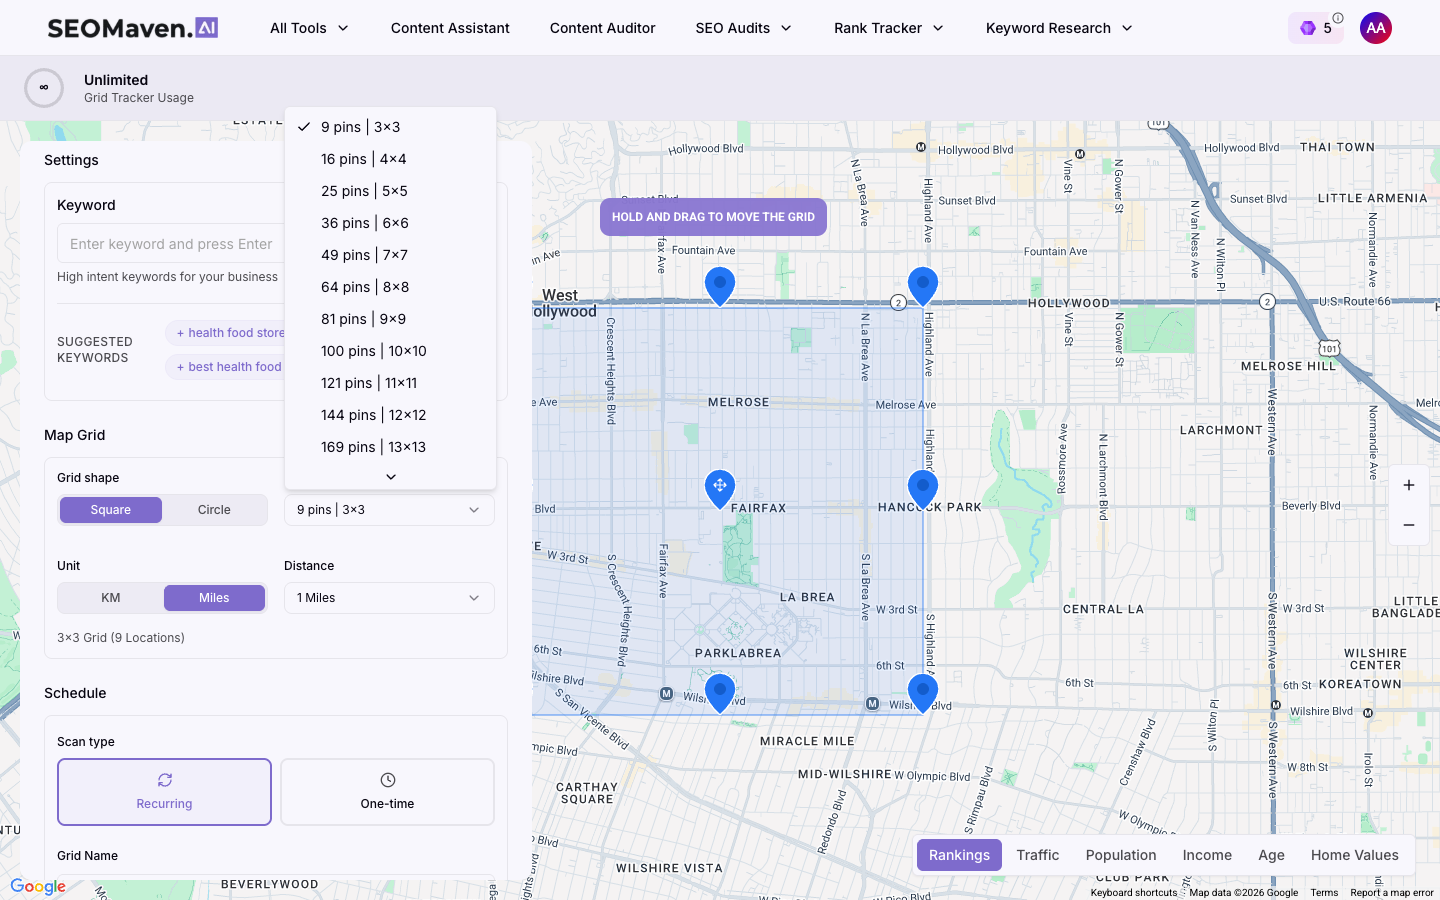
3×3 To 21×21 Grid Sizes
You pick the density. From a tight 9-point spot-check up to a 441-point full-service-area sweep. Competitors lock you into one shape.
Client-Ready Reports
Public share links plus PDF, PNG, and CSV exports. Hand a scan to a client without giving them a login — and recurring scans keep the link fresh on every run.
200,000+ Locations Worldwide
Country, state, city, or zip-code precision. Drop a pin anywhere we serve and we’ll scan it.
Unlimited Businesses + Keywords
No business-profile cap. No keyword cap. Run as many businesses and as many keywords per scan as your DataForSEO key supports.
Same features competitors charge $200/mo for. Yours at SEOMaven for 50–90% less. Math, not a strategy.
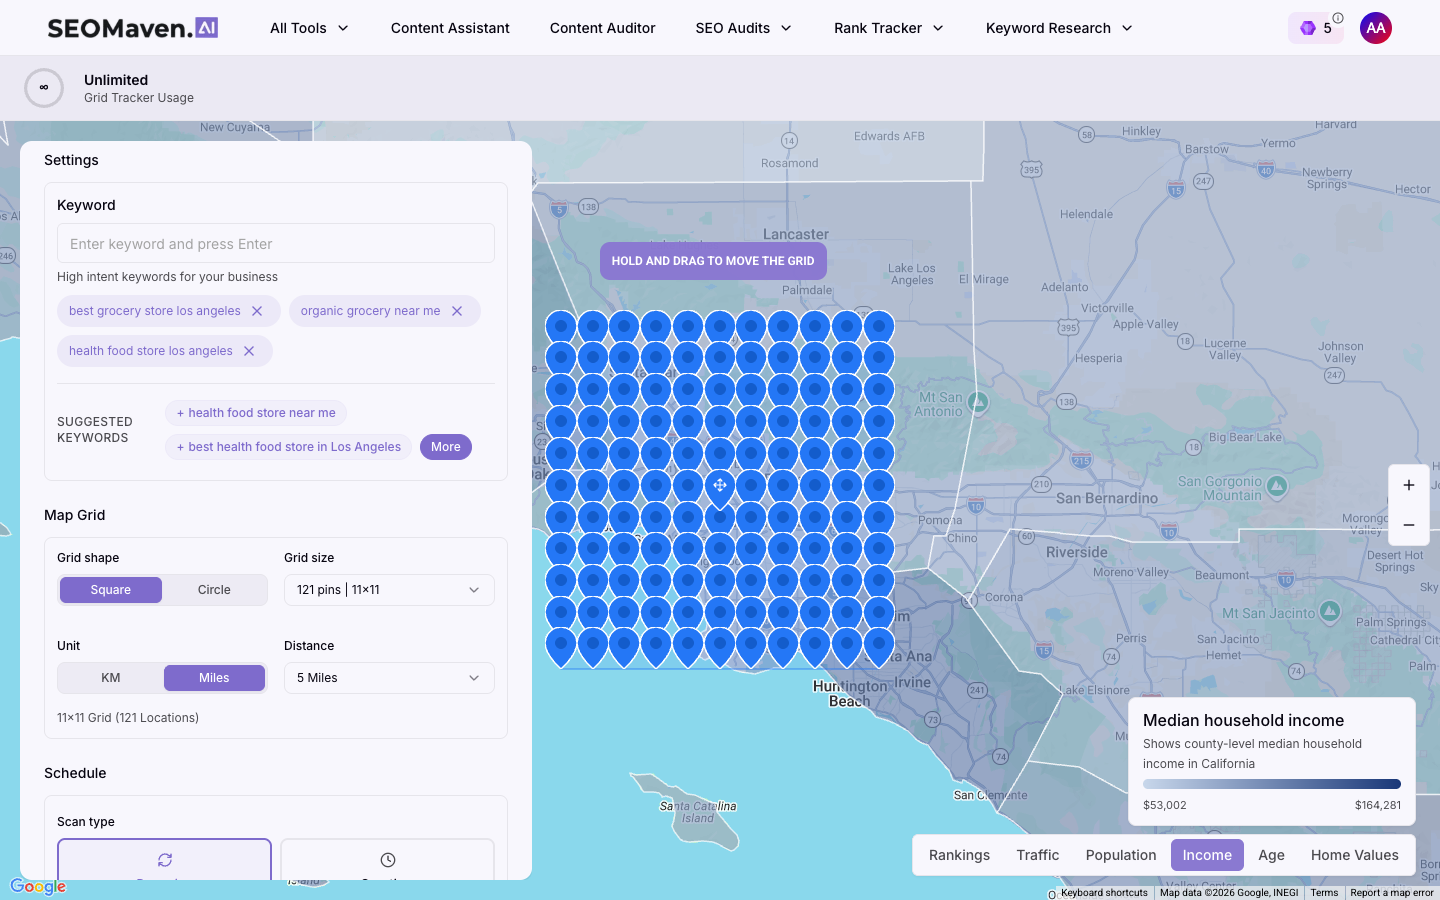
Sandbox Every Setting Before The Scan Runs.
See the grid sketched on the map. Pick the schedule. Set demographics layers. Then submit.
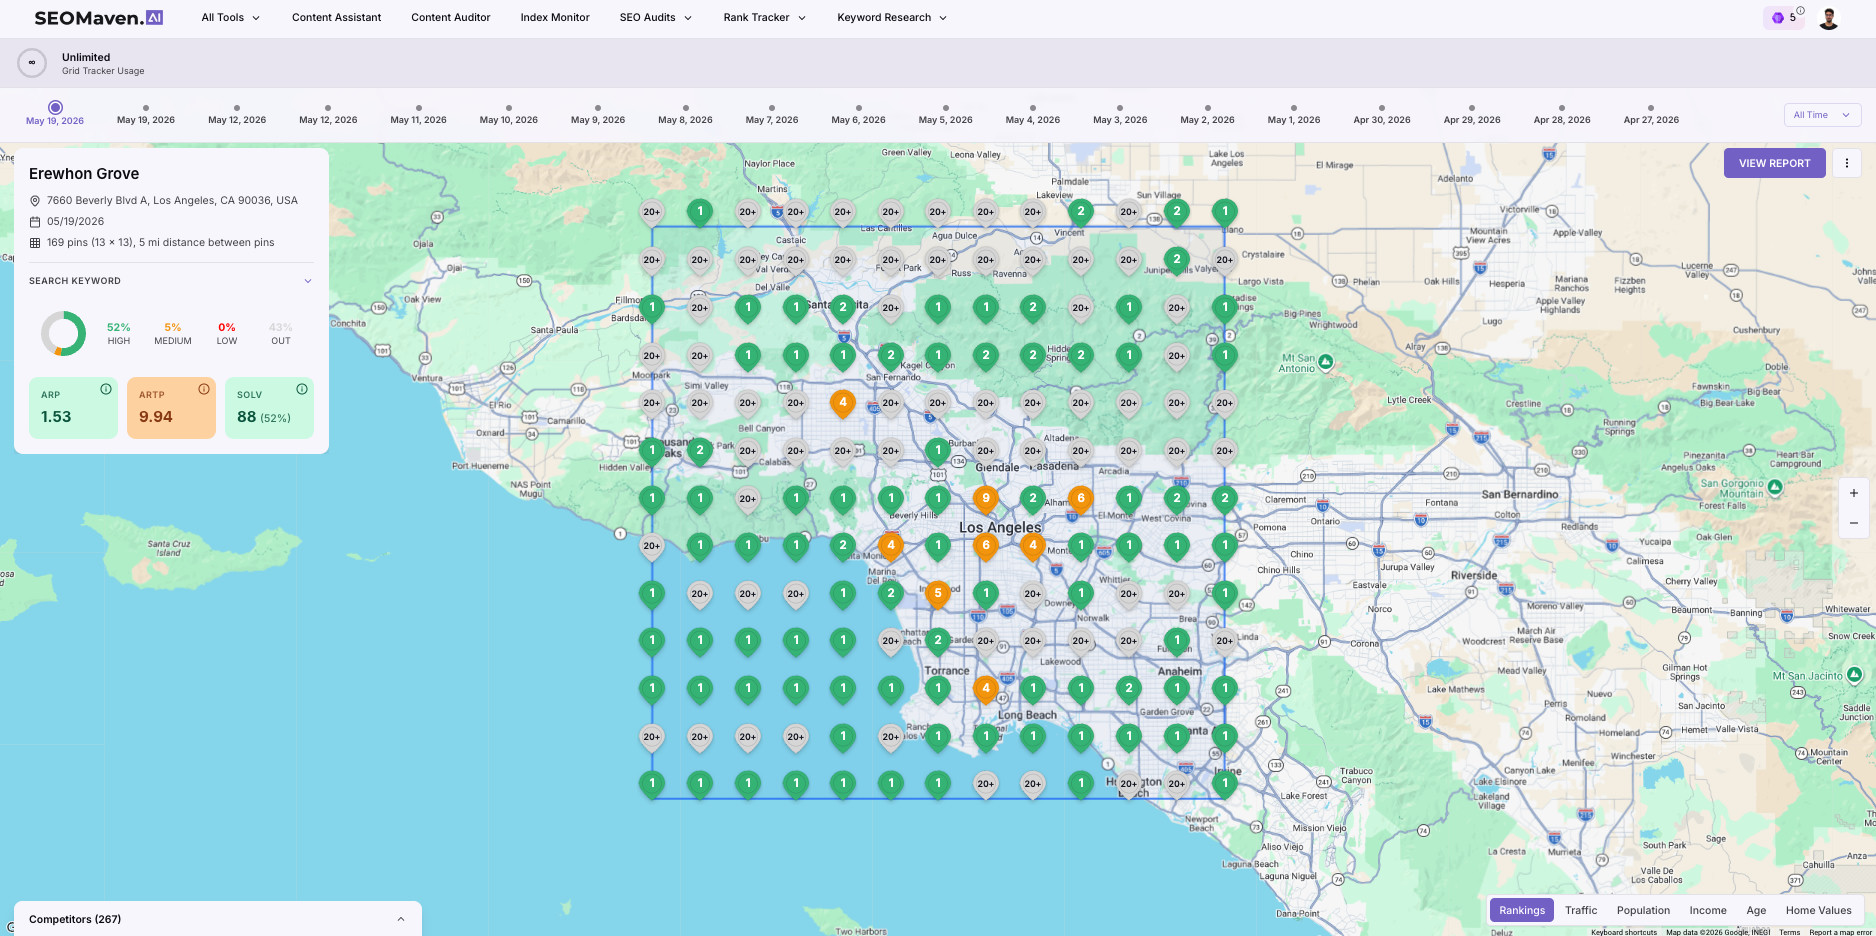
Map Every Block Of Your Service Area
Google ranks businesses block-by-block. So should your tracking.
Pay For The Density You Need.
More points = more accuracy, but more credits. Pick the trade-off that fits your budget — every grid point is one DataForSEO query at wholesale.
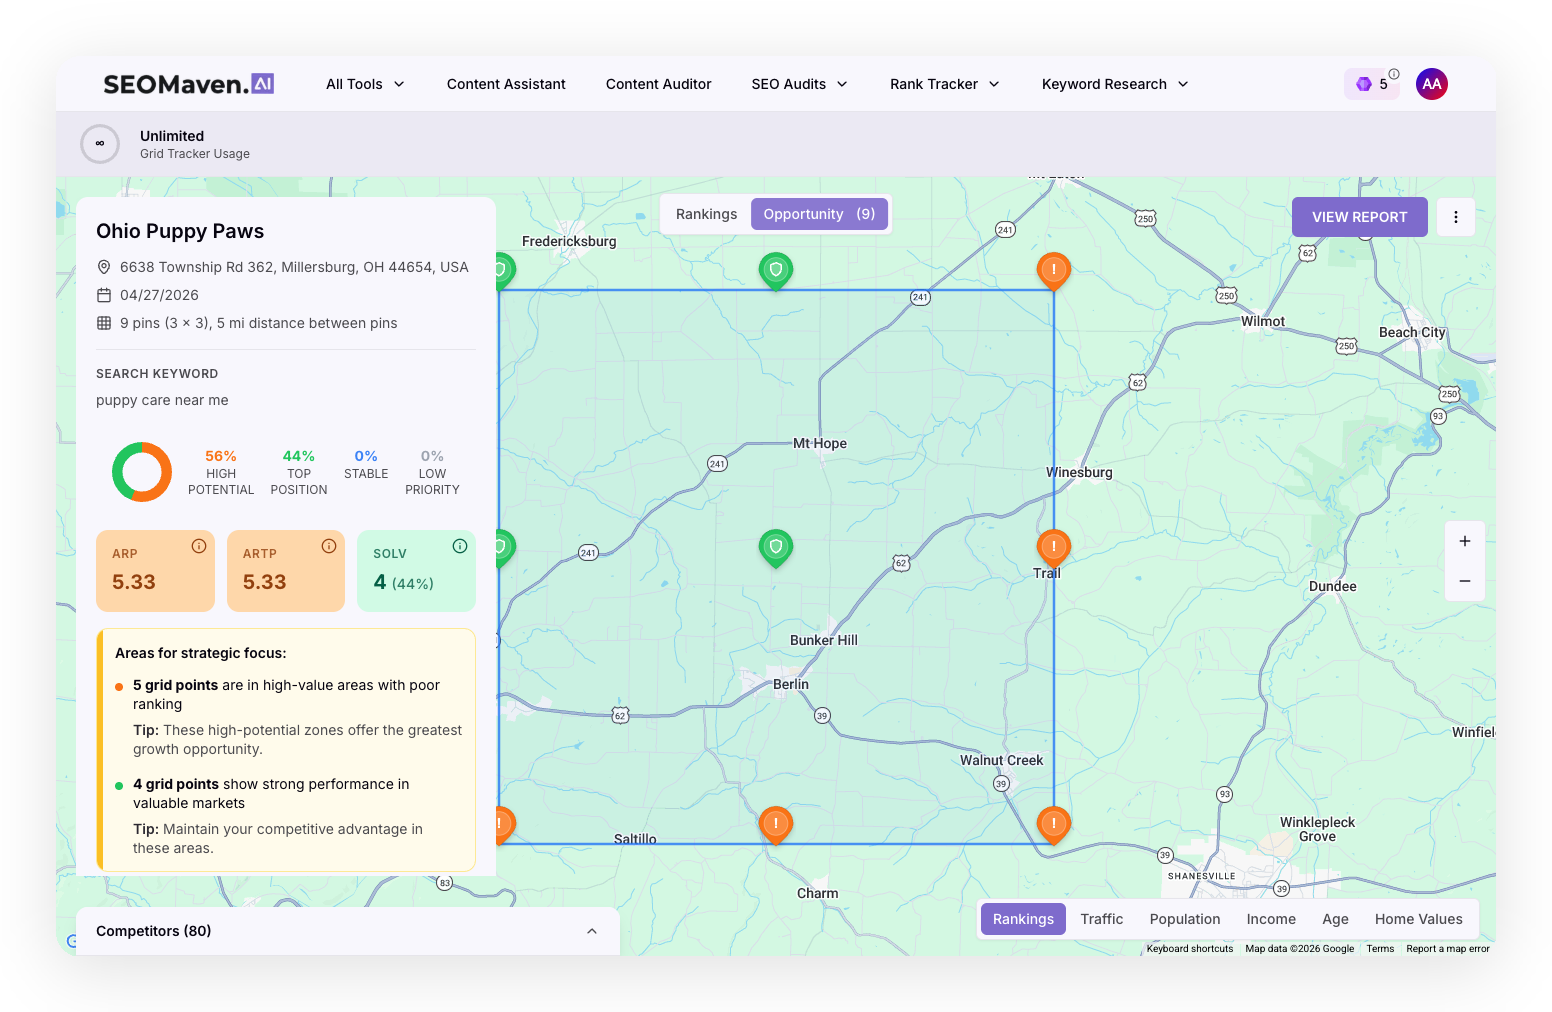
Don’t Guess Where To Focus.
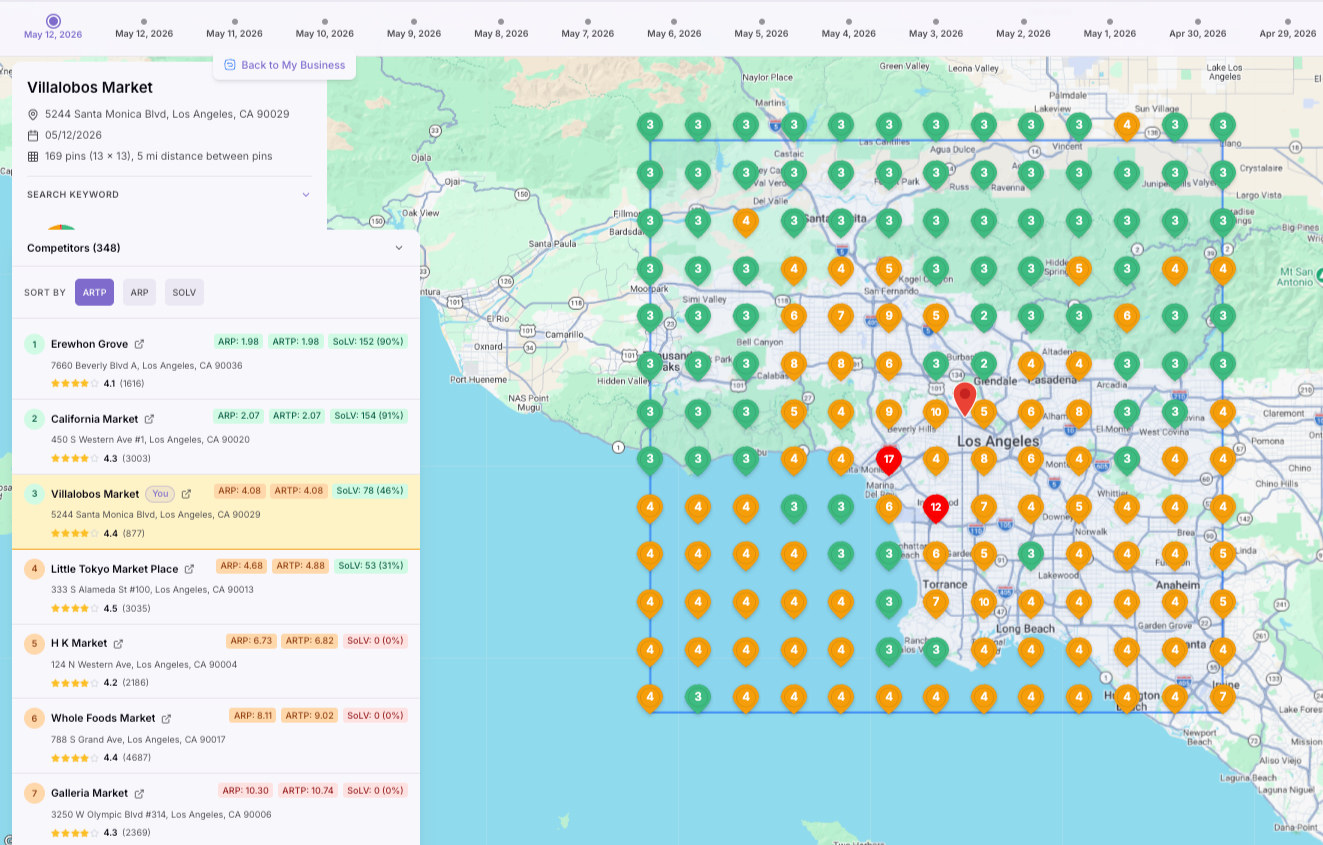
Find the blocks where you’re winning — and the ones you’re invisible. We score every grid point on rank × area value so you know which to fight for next.
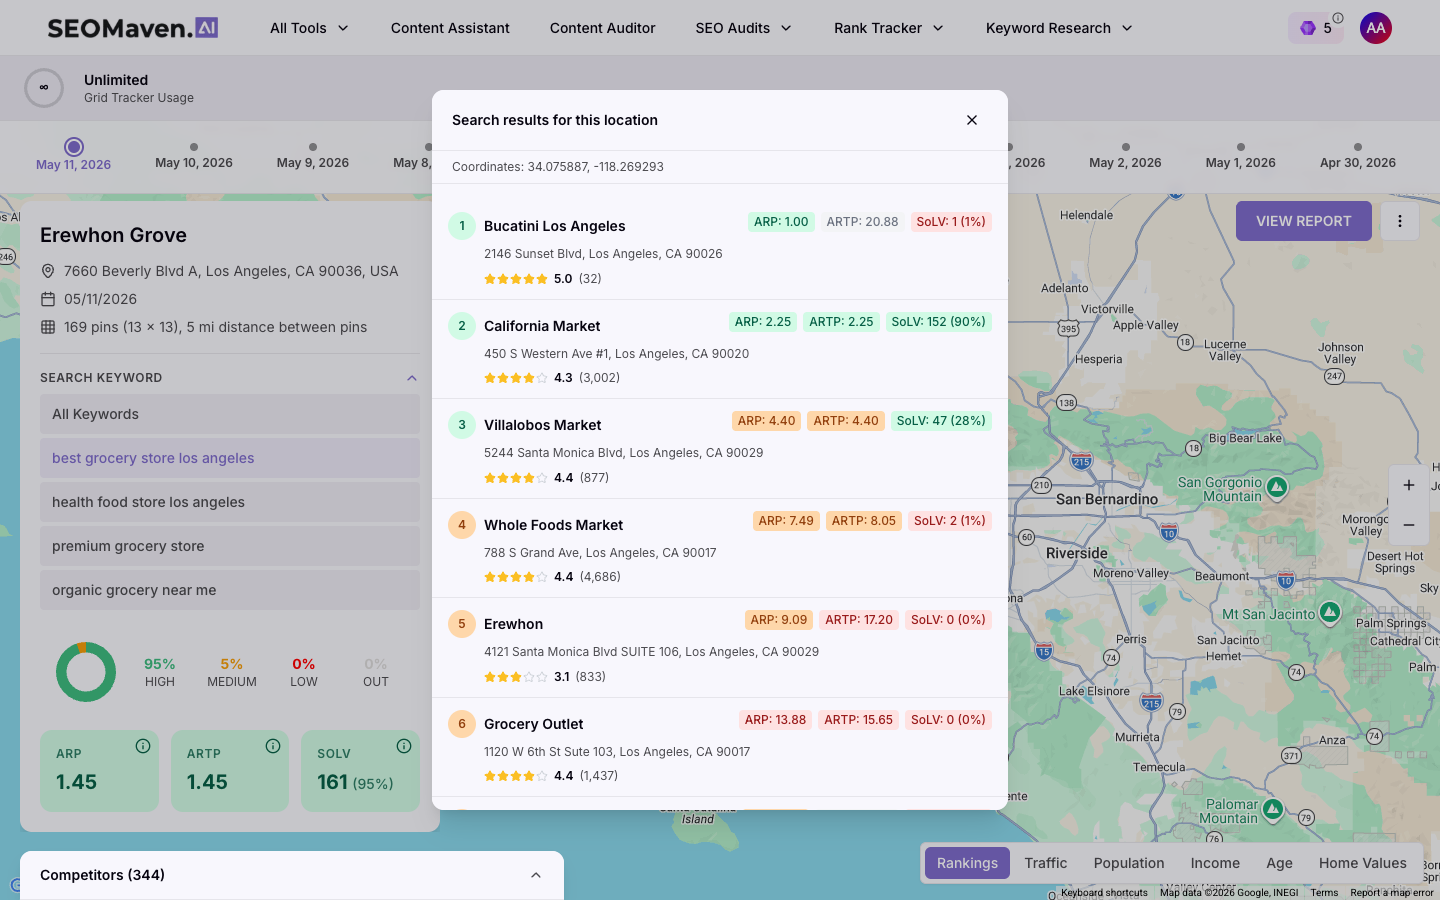
Know Your Real Competition
Stop tracking the businesses you think compete with you. Track the ones actually beating you on the map.
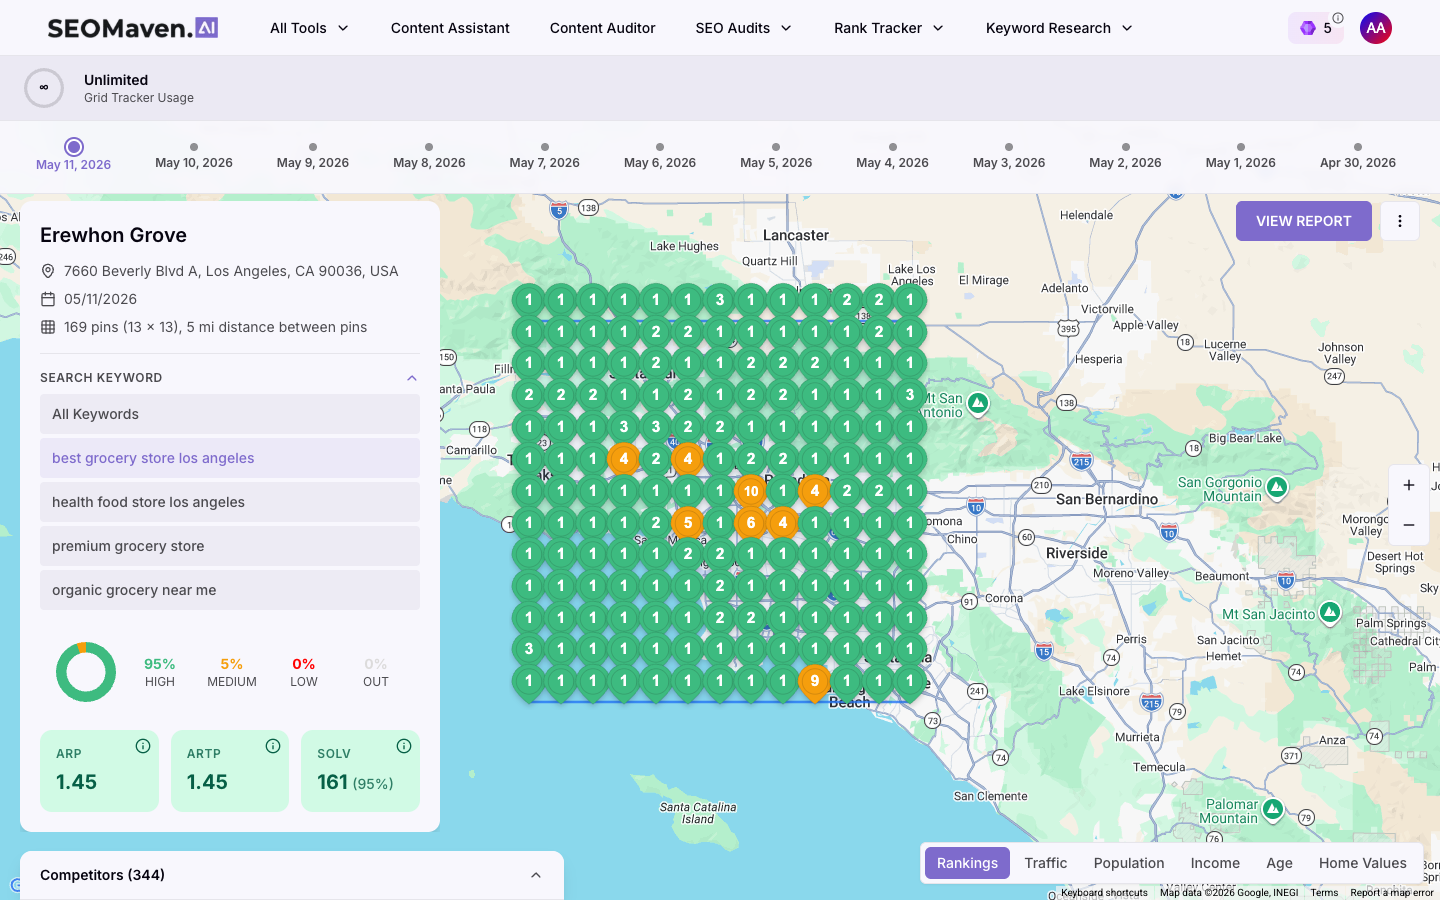
ARTP = Average Real-Time Position · ARP = Average Reported Position · SoLV = Share of Local Voice
Rank Where The Money Is.
Every grid point bucketed by area value × your rank — so your next move is obvious.
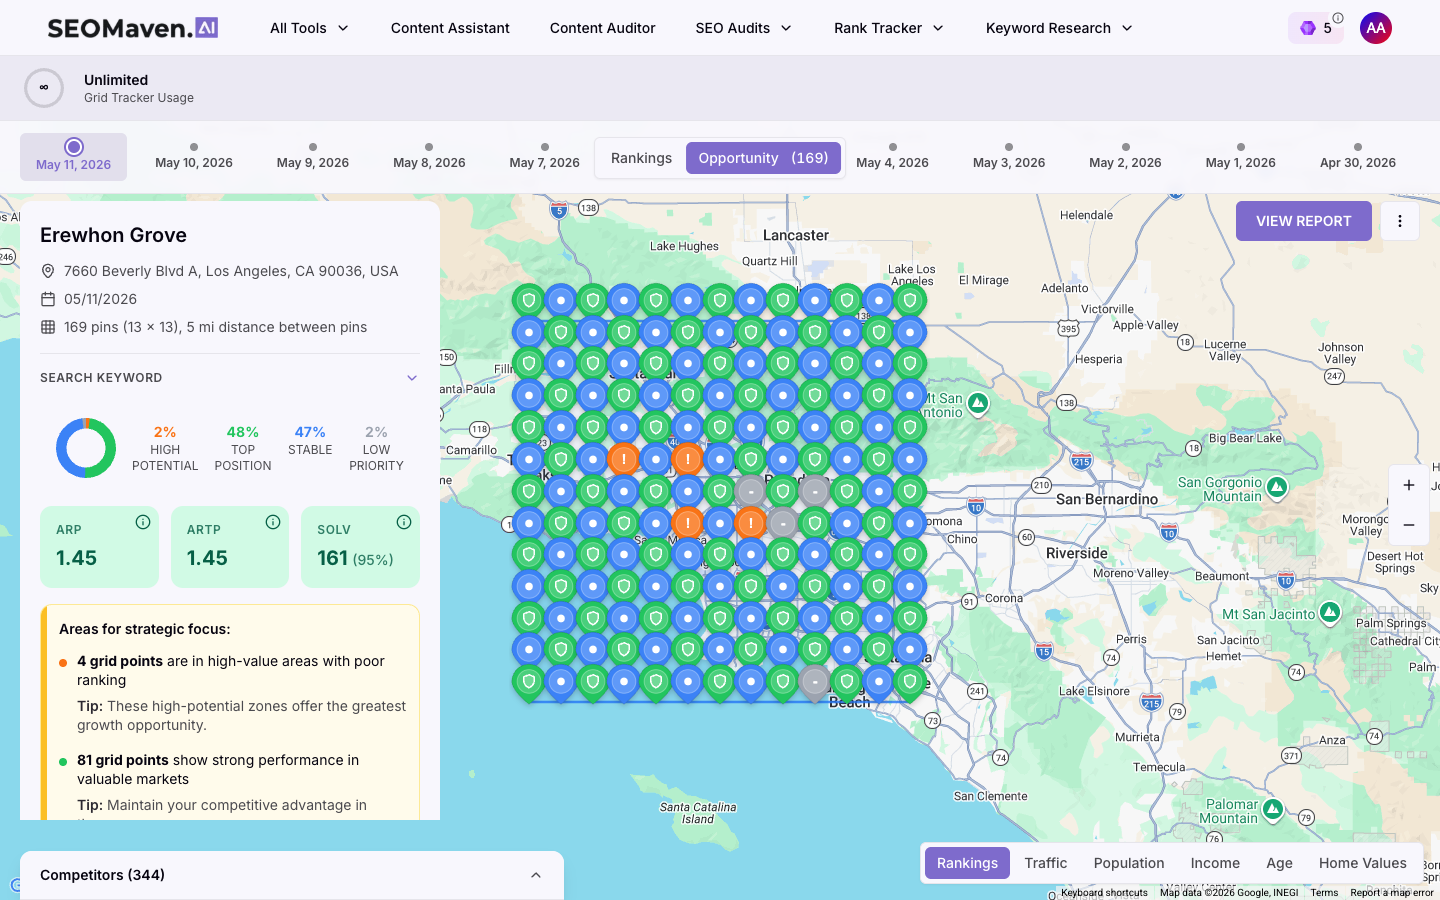
Don’t Rank Where The Money Isn’t.
Layer median income, home values, and population data on every scan — so you stop spending SEO budget on neighborhoods that can’t afford you.
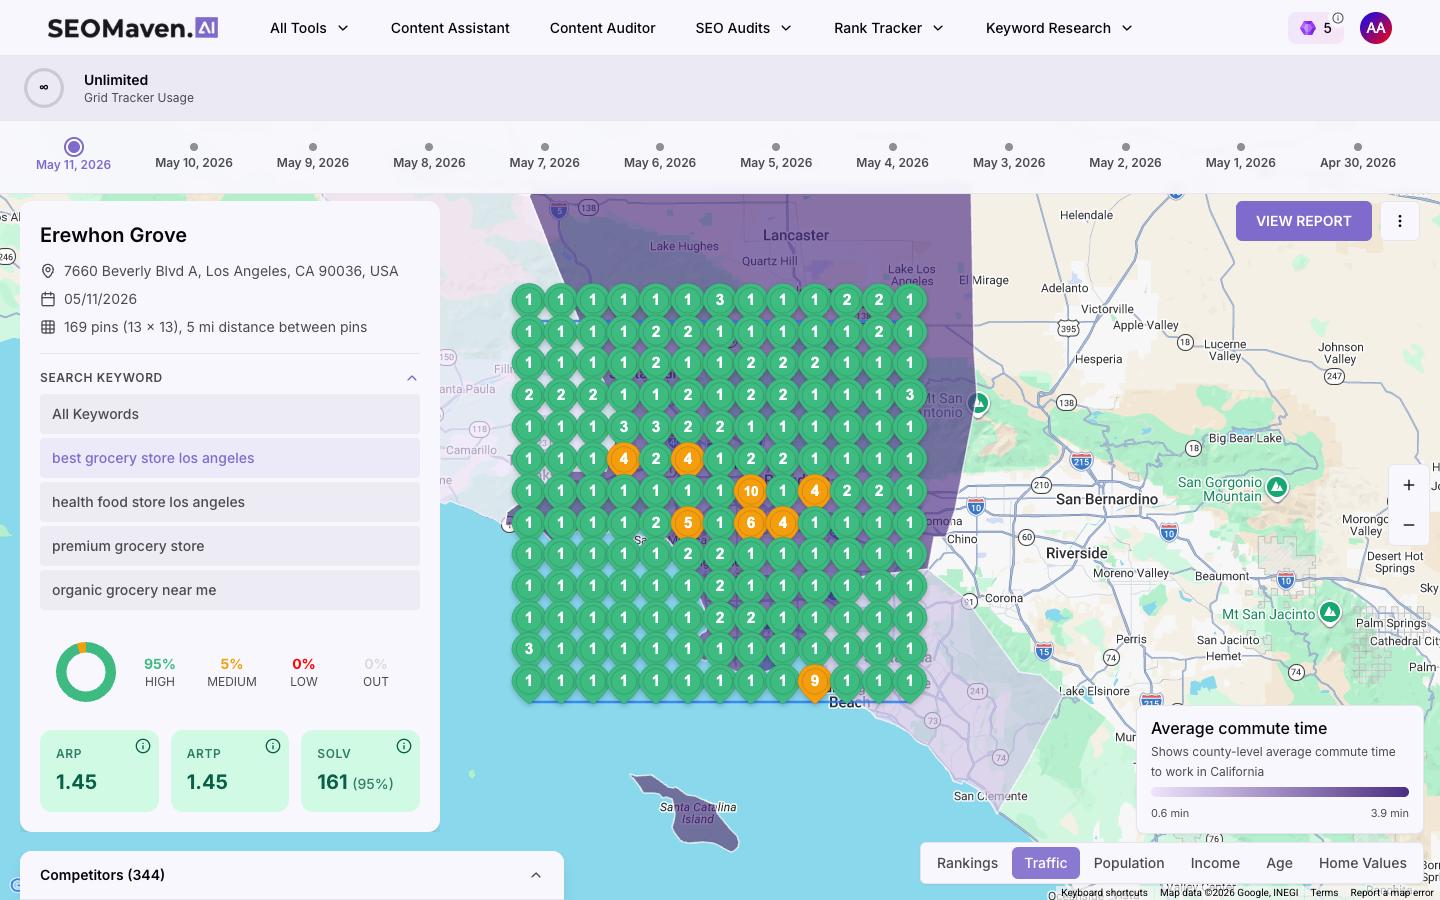
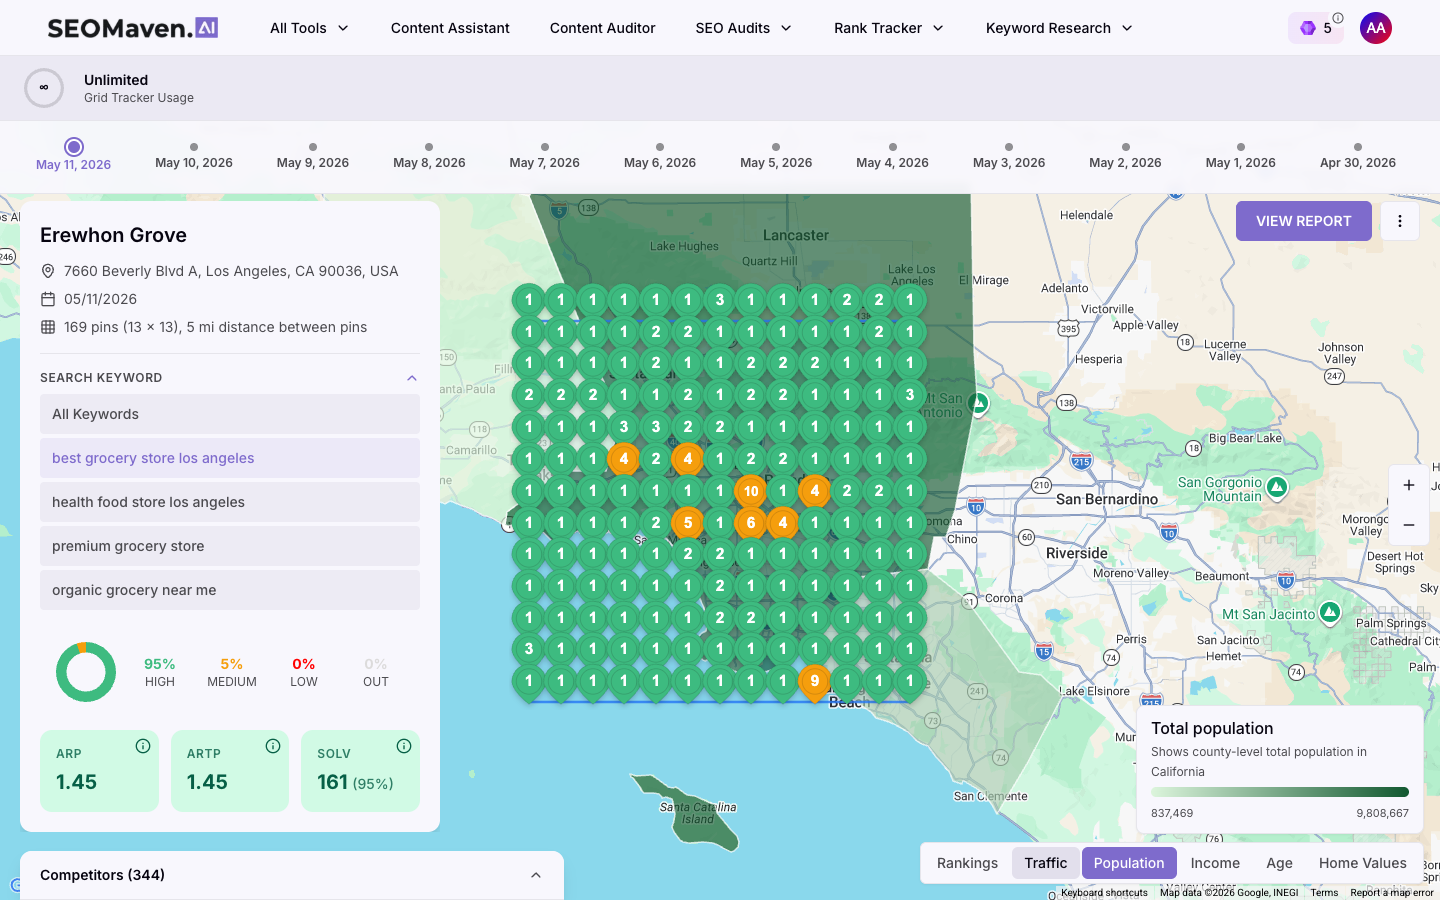
Traffic
Average commute time across every grid point. Long commutes signal service-area demand for travel-adjacent businesses (roofing, HVAC, automotive).
Population
Total population density per census tract. Find where customers actually live — not just where businesses cluster.
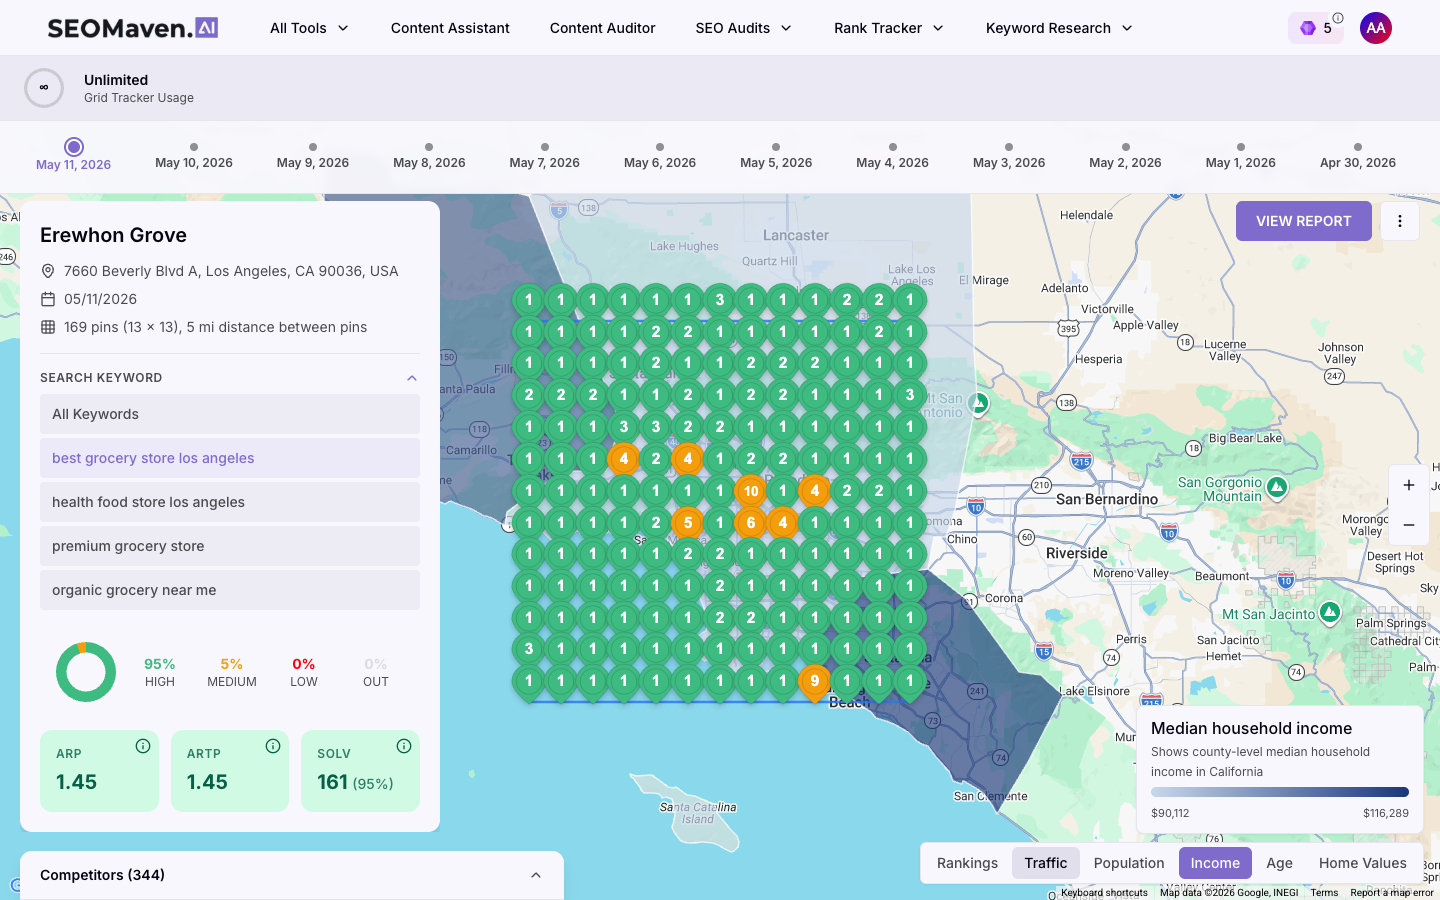
Income
Median household income shaded county-by-county. Spot the high-spending neighborhoods you’re invisible in.
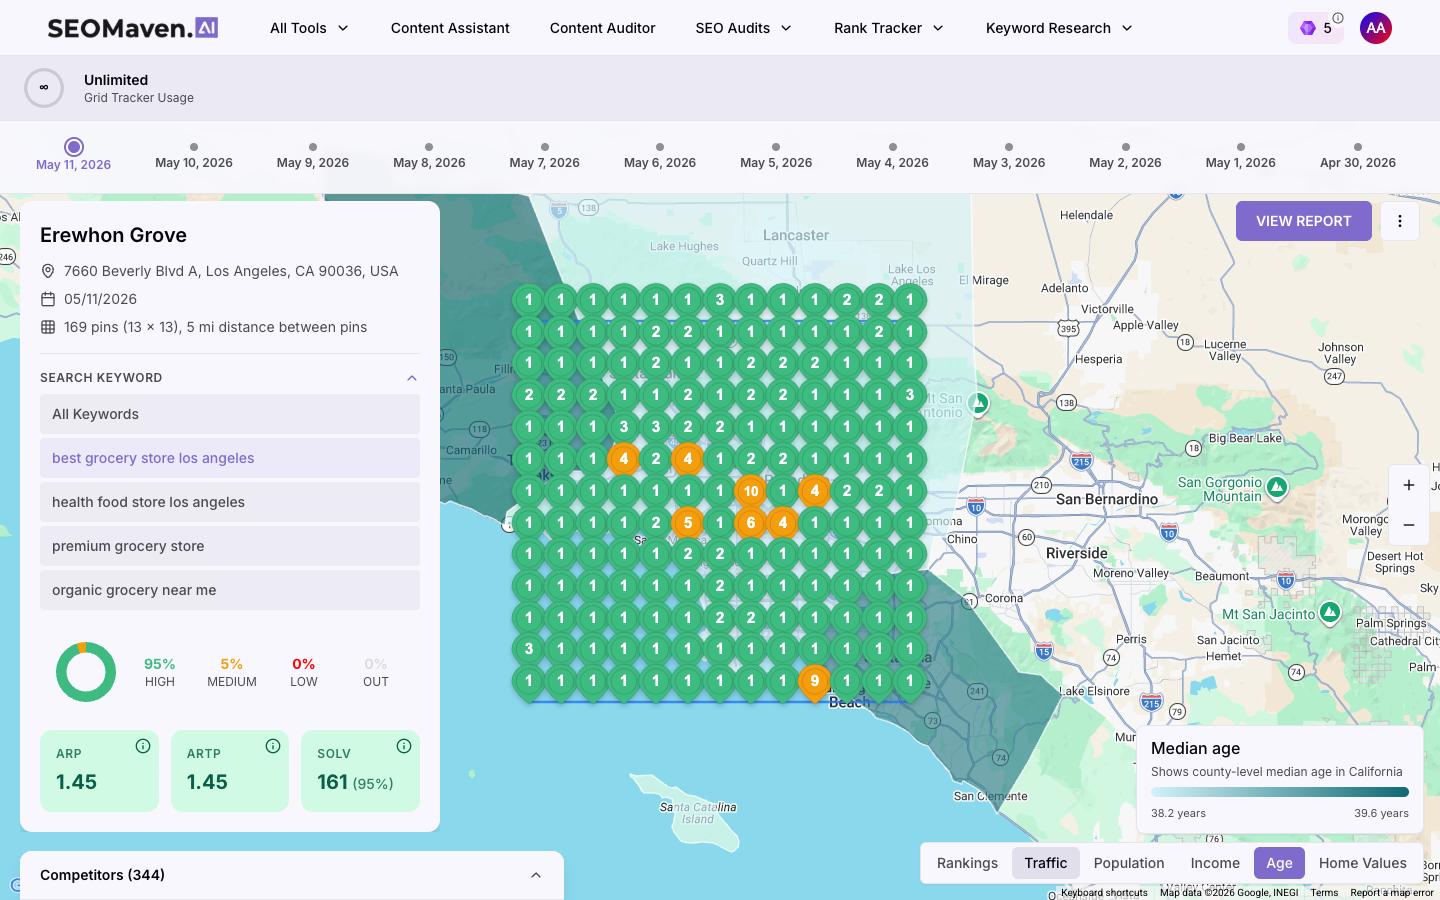
Age
Median age per tract. Age-skewed services (senior care, mid-life roof replacement, family-home HVAC) match this directly.
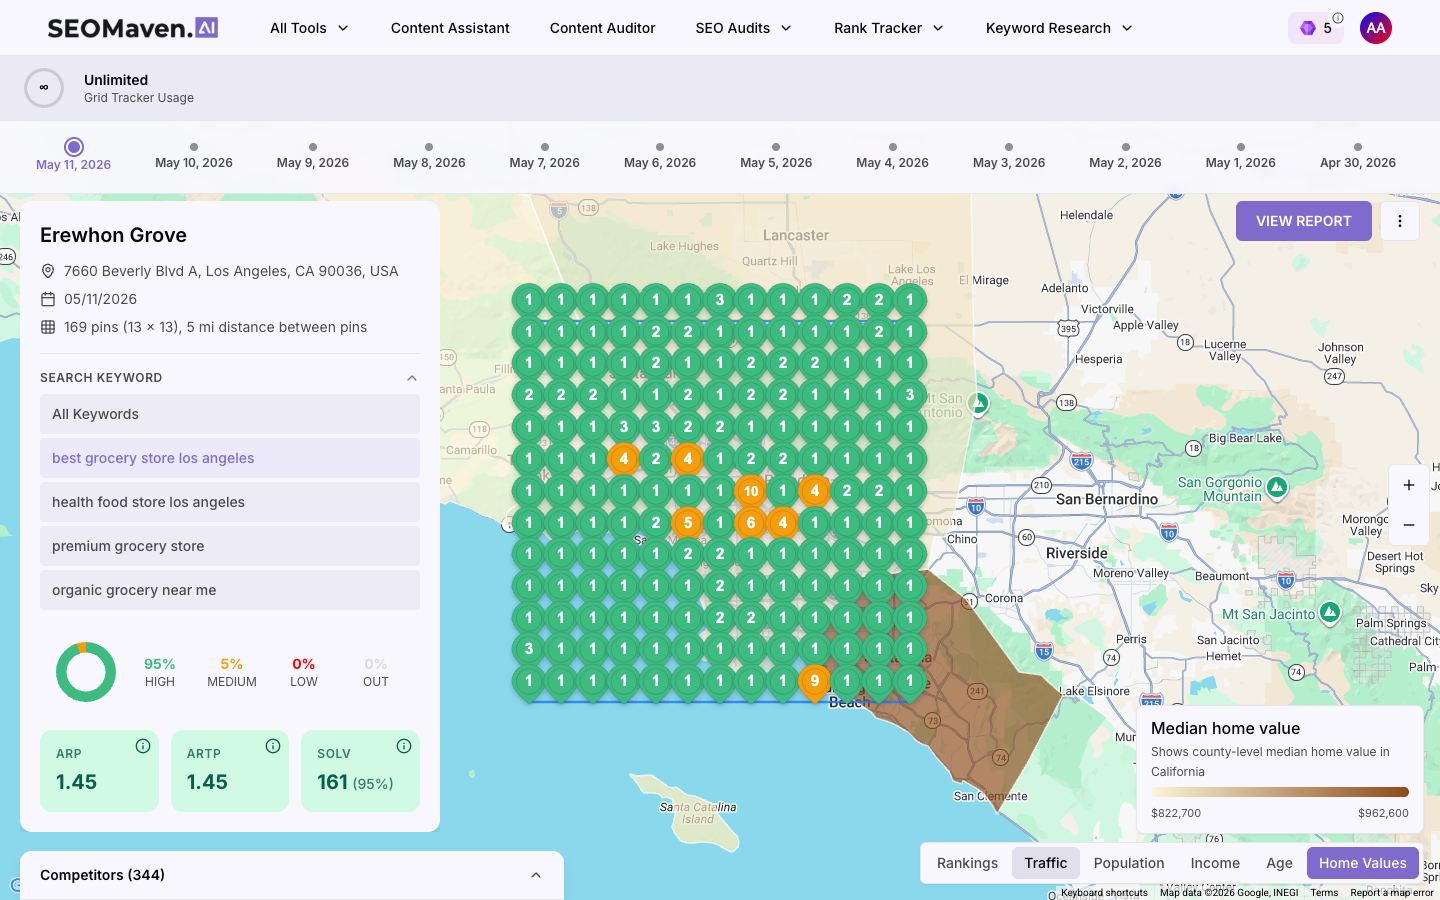
Home Values
Median home value — proxy for spending power in service categories where rank-without-income is wasted.
Re-Render The Entire Grid From Any Competitor’s Point Of View.
Click any competitor in the leaderboard and the entire grid re-renders from their perspective. Same keywords, same grid, but now you’re staring at their wins and losses. You learn which neighborhoods they own, which ones they’re vulnerable in, and which keywords they’re missing entirely.
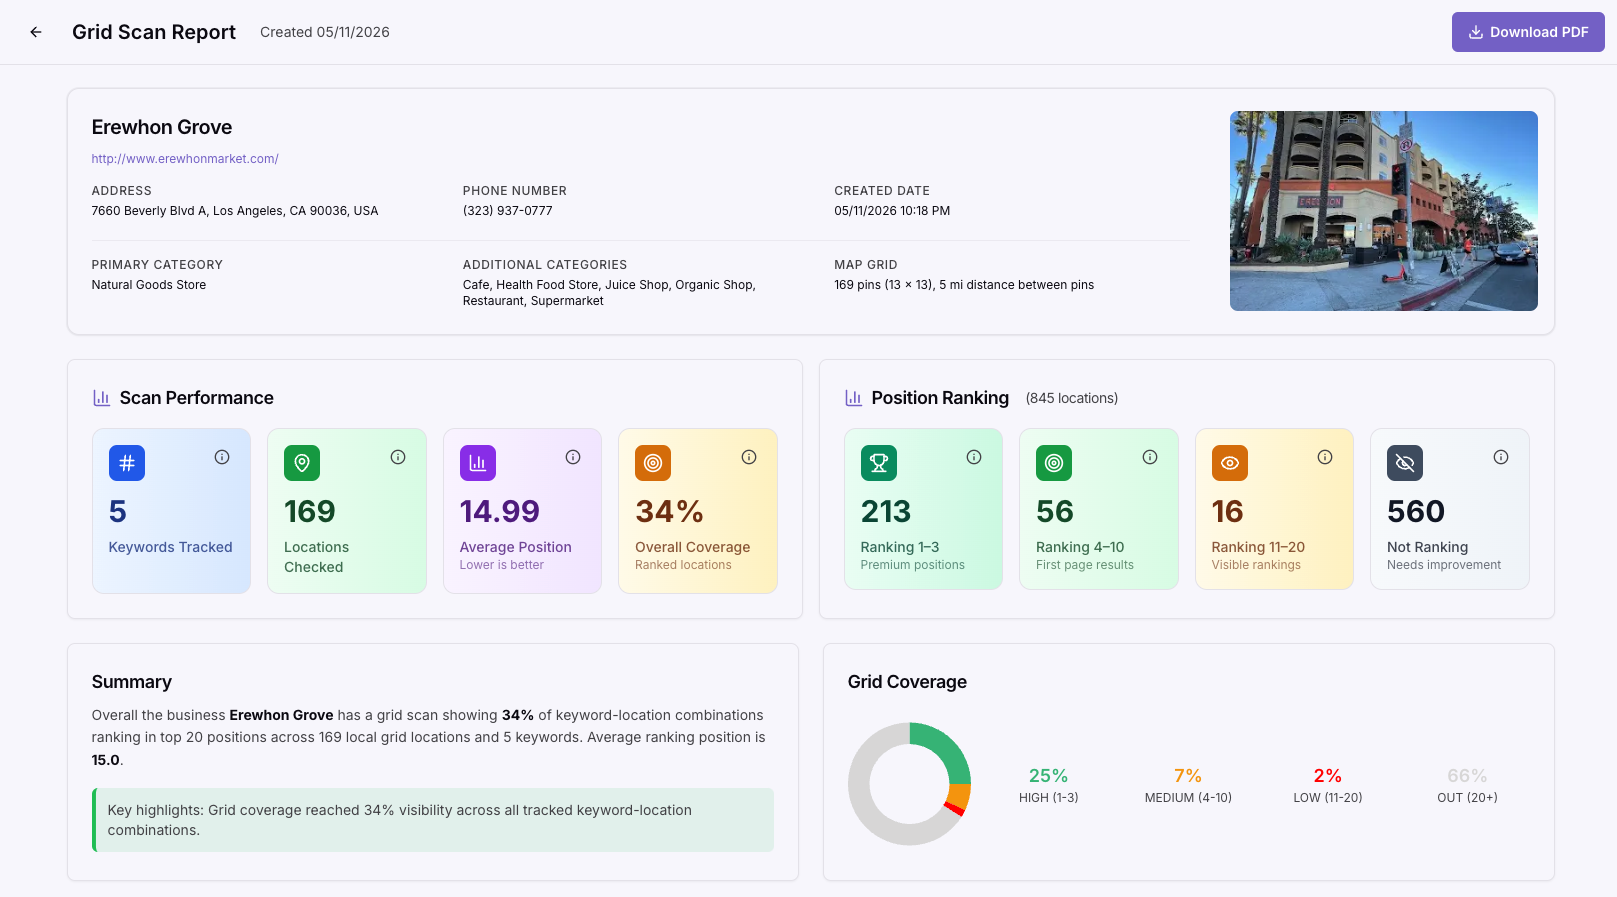
Project Performance At A Glance.
Every scan rolls up into one dashboard. Trends, breakdowns, and the metrics agencies actually report on.
We Picked The Best-Priced Leader In The Market — And We’re Half As Much.
Local Falcon set the standard. We model their tiers, then charge 50% less — every step up the credit ladder. Bring your own DataForSEO key, pay wholesale, no platform markup.


Free tier
✅ Free 7,500 credits/mo
❌ None
❌ None
❌ None
Cost per 1,000 credits
$1.67 all-in (Starter + DFS)
$3.33
$4.00
$599.93
Max credits/month
15K to 1.67M credits/mo across 6 tiers
1.67M cap (Enterprise 4 — $4,999/mo)
65,000+ cap (Custom — $200+/mo)
350 cap (Superhero — $139.99/mo)
Bring your own DataForSEO key
✅ Yes — wholesale pricing
❌ No
❌ No
❌ No
🏆 SEOMaven wins on cost, scale, and ownership. Only tool that lets you bring your own DataForSEO key — pay wholesale, not retail.
SEOMaven all-in = a flat platform fee + your DataForSEO credit cost at wholesale ($0.0006/credit). Bring your own DataForSEO API key. Competitor prices verified from public pricing pages, May 2026.
GeoGrid Cost Calculator
You bring the DataForSEO key. We charge $0 markup. Pay only for what you scan — see the math.
Credits / scan121
Monthly credits3,630
DFS rate$0.0006 / credit
Monthly DFS cost (wholesale)$2.18
Get Started
Free
$0/mo
No card required. Map your own business.
- 7,500 credits/month
- Unlimited Keywords
- Unlimited Locations
- Global Availability
- Service Area Business Scans
- Scheduled Scans
- Variable Grid Sizes (3×3 to 21×21)
- Attack & Defend Quadrants
- US Census Demographics
- Public Report URLs
- CSV and PDF Exports
Guaranteed 50–90% savings vs competitors. If not, you don’t pay.
Starter
$16/mo
Solo SEOs and first clients. Bring your own DataForSEO key.
- 15,000 credits/month
- Unlimited Keywords
- Unlimited Locations
- Global Availability
- Service Area Business Scans
- Scheduled Scans
- Variable Grid Sizes (3×3 to 21×21)
- Attack & Defend Quadrants
- US Census Demographics
- Public Report URLs
- CSV and PDF Exports
Guaranteed 50–90% savings vs competitors. If not, you don’t pay.
Most Popular
Agency
$64/mo
Multi-location agencies. The mid-tier sweet spot.
- 63,000 credits/month
- Unlimited Keywords
- Unlimited Locations
- Global Availability
- Service Area Business Scans
- Scheduled Scans
- Variable Grid Sizes (3×3 to 21×21)
- Attack & Defend Quadrants
- US Census Demographics
- Public Report URLs
- CSV and PDF Exports
Guaranteed 50–90% savings vs competitors. If not, you don’t pay.
Best $/Credit
824K Credits
$249/mo
Scale tier. Per-credit price drops from $1.07 → $0.30.
- 824,000 credits/month
- Unlimited Keywords
- Unlimited Locations
- Global Availability
- Service Area Business Scans
- Scheduled Scans
- Variable Grid Sizes (3×3 to 21×21)
- Attack & Defend Quadrants
- US Census Demographics
- Public Report URLs
- CSV and PDF Exports
Guaranteed 50–90% savings vs competitors. If not, you don’t pay.
Geo-Grid Tracking, Answered.
Everything an agency buyer asks before switching tools.
Do I need my own DataForSEO key?
Yes — and that’s the whole point. Plug in your own DataForSEO key and every Maps query is billed at wholesale, directly to you. We charge a flat software fee. No markup, no middleman, no “credit packs” that mysteriously deplete. If you don’t have a DataForSEO account yet, sign-up takes two minutes and we’ll walk you through it on the free plan.
How does SEOMaven actually save me 50–90%?
Other geo-grid tools bundle the SERP API into their subscription, then mark it up 3–10×. We don’t touch the API bill — you do. Run the calculator on this page with your real workload and the savings are itemized line-by-line. If your real savings come in under 50%, you don’t pay. That’s the guarantee.
Will my grid scans hit a credit ceiling and stop?
No arbitrary credit packs. Your DataForSEO key has whatever balance you put on it; our software fee is flat per month regardless of how many points you scan. Scale your grids up or down with no plan-upgrade gymnastics.
Can I run recurring grid scans, daily?
Yes. Switch any scan to daily, weekly, or monthly. Every execution is stored on the timeline and you can scrub through history dot by dot.
Can I share scans with clients without giving them a login?
Three ways: a public share link, an embeddable iframe for client portals, and a downloadable PDF. None require the client to log in.
Do you support international markets?
Yes. Any business listed on Google Maps anywhere in the world. Grid points are real lat/lng queries — no US-only limitation.
How accurate is the data?
Every grid point is a real Google Maps query executed via the official DataForSEO SERP API — the same source most professional rank trackers use. We don’t interpolate or estimate. Green = ranked, red = not ranked, period.
Is there a free trial?
Better — a free plan. Run a real 7×7 scan today, see the heat map, decide if the math holds. Upgrade when you outgrow it.
Ready To Ditch Your Overpriced Grid Tracker?
Free to start. 5 minutes to your first grid scan. Cancel any time.
Built for local SEO agencies and multi-location brands. Bring your own DataForSEO key. 50–90% savings guaranteed.